Senitment Analysis
Insights
Twitter has over 300 million active monthly users and so it is perfect avenue for a company to gain valuable social media insights. Analysing tweet sentiment can help an organization to monitor its brand, avoid crises, improve customer experience, products, and services, and ensure better target marketing.
The Absa twitter dataset was provided to us for this project. After loading the data, I extracted the cells that contained phrases related to Absa and any technological innovations in the banking space and I created a dataframe that consisted of only the ‘extract’ column, which was the column that contained the relevant tweets. I then cleaned this column by removing userhandles, hashtags, ‘RT’s, links, punctuations, contractions, special characters, numbers and stopwords. This clean data was then placed in a new column, ‘clean_tweets’ and I then dropped the ‘extract’ column was. I then created a dictionary that contained verbs, adverbs, nouns, and adjectives and defined a new function ‘token_stop_pos’ to tokenize the data, i.e., convert those tweets into small bits of data. This tokenized data was then put in the ‘POS tagged’ column and words were then tagged as either verbs, nouns, adverbs, or adjectives. I then defined the lemmatize function to get the root words of the words in the ‘POS tagged’ column.
I performed two WordCloud visualisations. The first one, shown below, displays all the commonly used words in the ‘clean_tweets’ column.
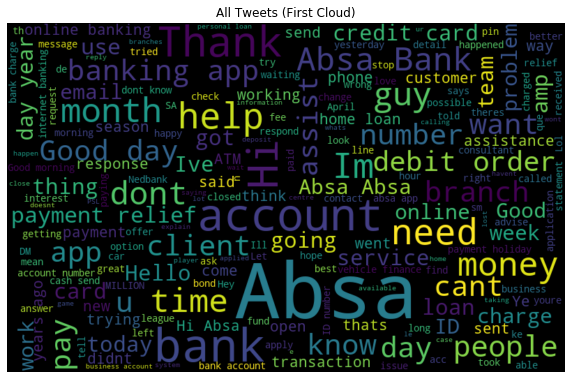
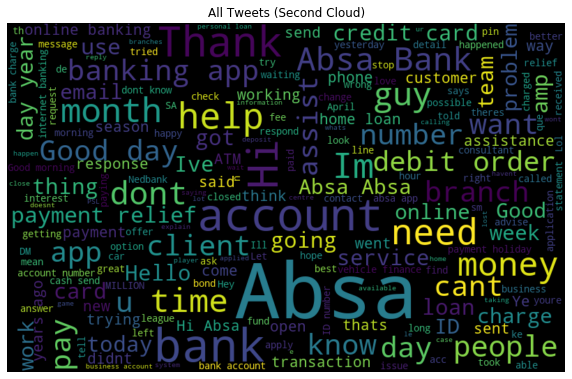
After examining this visualisation, I cleaned the data some more by removing all the words in the WordCloud that were not related to Absa and its technological innovations, e.g., lockdown, Kaizer Chiefs, etc. I then ran a second visualization to ensure that the data cleaning worked.
Once certain that data was sufficiently clean, I checked the subjectivity and polarity of the tweets and created corresponding columns in the dataframe to house the outputs. I added the ‘analysis’ column in the dataframe which showed whether a tweet was negative, positive, or neutral. I used the ‘analysis’ column to create a bar graph and after computing the percentages of the positive, negative, and neutral tweets I was then able to create a pie chart.
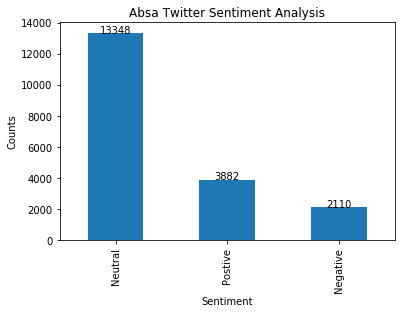
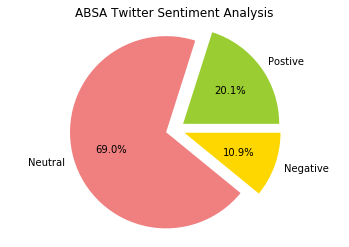
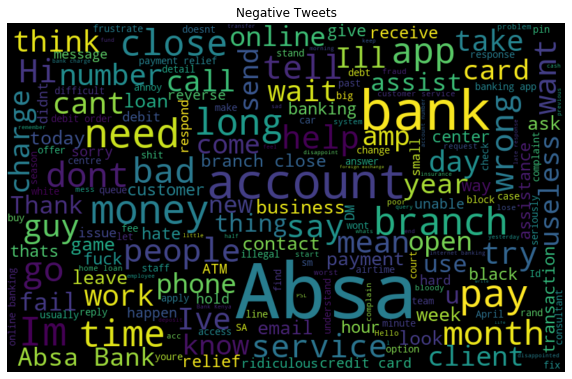
The analysis showed that 20.1% of tweets were positive with regards to Absa while 10.9% were negative and the remaining, 69%, were neutral. The high volume of neutral tweets points towards some of the limitations inherent in sentiment analysis using natural language processing. These may be cause by unrecognized abbreviations or the use of languages that the algorithm does not recognize or are not available. Be this as it may, actionable insights were gained in this endeavour. By diving deeper and creating WordClouds of the negative tweets, I was able to see what words or phrases were used in those tweets. For example, words such as long, charge, service, and time appeared quite prominently on the WordCloud. This may allude to customers having issues with consultants taking a long time to respond or resolve issue, issues with fees charged or the quality of customer services.
With this in hand, Absa is at a position to improve their customer experience and in so doing add more value to their clients.